A pan containing ice at –15 °C is placed on a gas heater.
Thermal conduction occurs in the metal from which the pan is made.
(a)By referring to particles, describe the process of thermal conduction in a metal.
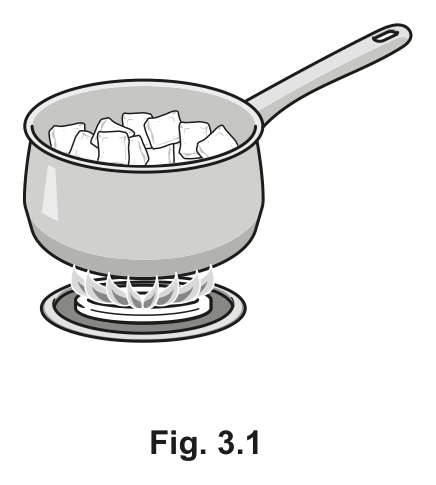
A pan containing ice at –15 °C is placed on a gas heater.
Thermal conduction occurs in the metal from which the pan is made.
(a)By referring to particles, describe the process of thermal conduction in a metal.
A pan containing ice at –15 °C is heated on a gas heater.
(b)(i)State the melting temperature of ice in kelvin.
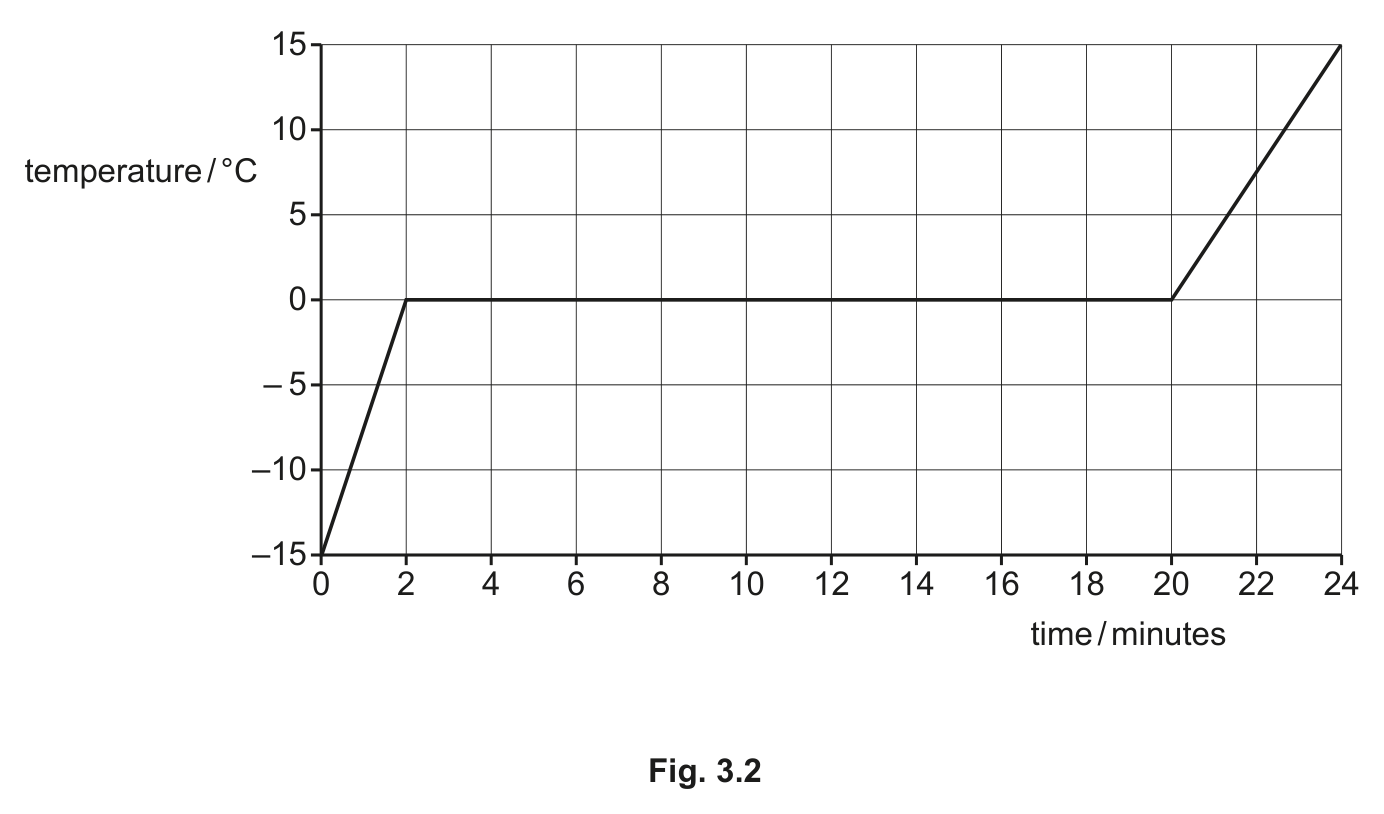
A pan containing ice at –15 °C is heated on a gas heater. The temperature–time graph (Fig. 3.2) shows a constant temperature of 0 °C between 2 minutes and 20 minutes while the ice melts.
(b)(ii)Explain why the temperature of the water is constant as the ice melts.
A pan containing ice is heated on a gas heater. The initial mass of ice in the pan is 1.5 kg and the initial temperature is –15 °C. The specific heat capacity of ice is 2100 J/(kg °C).
(b)(iii)Calculate the energy required to warm the ice to its melting temperature.
A pan containing 1.5 kg of ice at –15 °C is heated on a gas heater. The energy required to warm the ice to its melting temperature was calculated in (iii) (using specific heat capacity of ice 2100 J/(kg °C)).
All the energy transferred to the pan comes from the heater.
(b)(iv)Using your answer to (iii) and Fig. 3.2, determine the power of the heater used to warm the ice.
The graph in Fig. 3.2 has a smaller gradient when the water is liquid than when it is solid.
(b)(v)Suggest one reason why.
5054/21/M/J/24Cambridge O Level Physics 5054 · May/June 2024 · Paper 2 variant 1 · Question 3