2023 · Specimen · 5054/03 | Q1

BackNext
0/21parts marked · 0 of 40 marks
All questions
Question (1 of 4)10 marks · Practise this topic →
Options

Report Wrong question content

CIE-5054-2023-SP-p03 · Question 1

Practical test: laboratory apparatus, supervision and your own measurements are required. Do not invent observations. Upload clear working and graphs with the readings used.

Investigate the effect of varying the light reaching an LDR. Fig. 1.1 shows the apparatus: a power supply, switch, LDR, resistor, voltmeter and leads, a 250 cm³ glass beaker containing 150 cm³ water, a light source, cloudy liquid, a 5 cm³ syringe, stirrer and paper towels. Use your own laboratory measurements.

(a)Switch on the light and close the switch. Measure the voltmeter reading in V. Record it in the first row of Table 1.1, at 0 cm³ of added cloudy liquid.
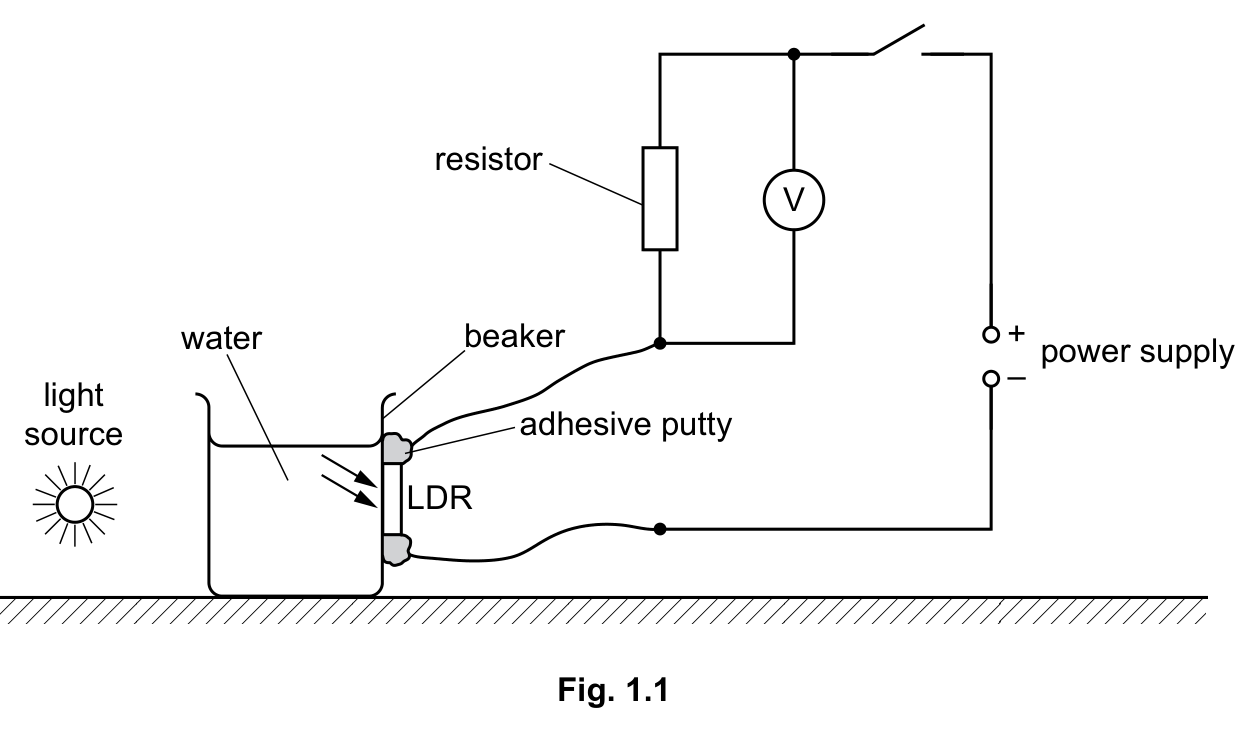
Fig. 1.1 — see the question text for what it shows
Answer guidance

Using You must use the thing it names. An answer that reaches the right value another way may not score.

[1 mark]

This part can’t be checked automatically, and its answer is your own measurement, so there is no explanation for it.
(b)Use the syringe to add 2 cm³ of cloudy liquid to the water and stir. Repeat, recording the voltmeter reading each time. Table 1.1: volume of cloudy liquid / cm³ = 0, 2, 4, 6, 8, 10, 12; record a voltmeter reading / V for each volume.

Answer guidance

Using You must use the thing it names. An answer that reaches the right value another way may not score.

[1 mark]

This part can’t be checked automatically yet. Compare your own working with the explanation below.

Show explanationHide explanation

One correct answer. This part can’t be checked automatically yet, so compare your own working with it.

Use the syringe to measure 2 cm³ of cloudy liquid, add it to the beaker and stir before you read the voltmeter. Keep going, 2 cm³ at a time, until you have added 12 cm³ in total, so every one of the six empty rows in Table 1.1 (2 cm³ to 12 cm³) has a reading.

The mark is for six more readings all written to the same number of decimal places. Record each reading to the precision your voltmeter shows and keep that number of decimal places down the whole column, including a final zero where needed.

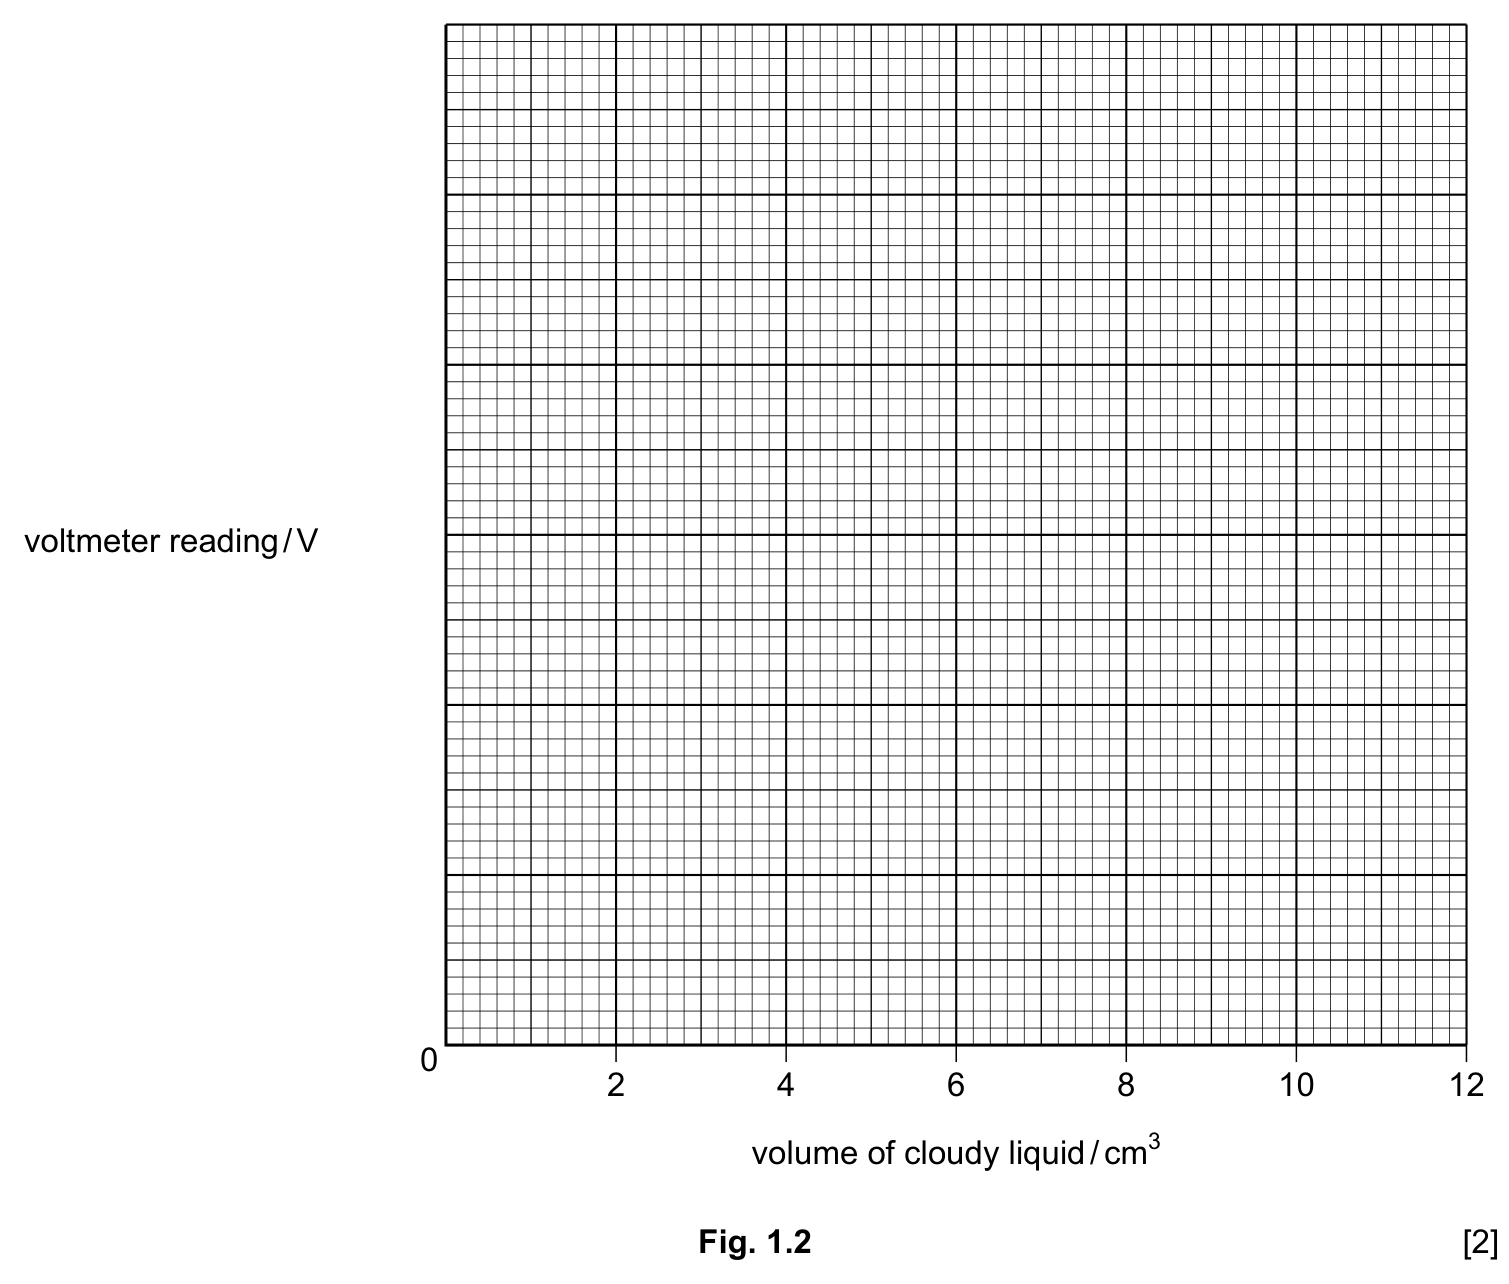
(c)On Fig. 1.2, plot your voltmeter readings against the volume of cloudy liquid and draw the best-fit curve.

Fig. 1.2 — see the question text for what it shows
Answer guidance

Using You must use the thing it names. An answer that reaches the right value another way may not score.

[2 marks]

This part can’t be checked automatically yet. Compare your own working with the explanation below.

Show explanationHide explanation

One correct answer. This part can’t be checked automatically yet, so compare your own working with it.

Choose a simple scale for the voltmeter-reading axis so you can plot accurately, then plot all seven points from Table 1.1. Each point must sit within half a small square of its true position, so mark it with a small, neat cross.

Draw one smooth curve through the trend, not dot-to-dot and not a ruled straight line, with the points evenly scattered on either side of it. The curve must slope downwards along its whole length (the gradient stays negative): as more cloudy liquid is added, less light reaches the LDR, its resistance rises and the voltmeter reading across the resistor falls.

(d)(i)Draw a tangent to your curve in Fig. 1.2 at 5 cm³.

Answer guidance

Draw Accuracy is being marked. Use the figure and be precise about position and labels.

[1 mark]

This part can’t be checked automatically yet. Compare your own working with the explanation below.

Show explanationHide explanation

One correct answer. This part can’t be checked automatically yet, so compare your own working with it.

Find the point on your curve directly above 5 cm³ on the volume axis. Lay a ruler against the curve there and draw a straight line that just touches the curve at that point, with the same slope as the curve at that point, rather than cutting across it.

Draw the tangent long, across much of the grid. In (d)(ii) you will need two points on it that are well separated: the scheme wants them at least 5 cm apart along the line.

(d)(ii)Calculate the gradient of the tangent. Show your working and indicate on your graph in Fig. 1.2 the values you use.

Answer guidance

Show The result is given, so every step of the reasoning is what earns the marks.

[2 marks]

This part can’t be checked automatically yet. Compare your own working with the explanation below.

Show explanationHide explanation

One correct answer. This part can’t be checked automatically yet, so compare your own working with it.

Pick two points on your tangent line itself (not data points from the table) that are far apart: the scheme needs them at least 5 cm apart on the paper, measured along the tangent. Mark both on the graph, read their coordinates carefully from the axis scales and write them down as (x1, y1) and (x2, y2).

Calculate gradient = Δy/Δx = (y2 − y1)/(x2 − x1), writing your numbers in, then evaluate it. The tangent slopes downwards, so the voltage falls as the volume increases and the gradient is negative: keep the minus sign. Give the unit, V/cm³, with your answer, because a missing or wrong unit can cost the final calculation mark.

(e)Describe one precaution to ensure that the reading from your voltmeter is accurate.

Answer guidance

Describe Say what happens, in order. Reasons are not required unless the question also asks why.

[1 mark]

This part can’t be checked automatically yet. Compare your own working with the explanation below.

Show explanationHide explanation

One correct answer. This part can’t be checked automatically yet, so compare your own working with it.

Describe one precaution that makes the voltmeter reading accurate. The scheme accepts any one of: checking that the voltmeter reads zero before the switch is closed (no zero error); checking that the voltmeter is set to the correct range; gently tapping the meter before taking the reading; or checking that the wires are firmly connected. Give one clear answer.

Do similar questions

(f)Another student obtains a slightly different gradient. Suggest two variables which are difficult to control that may cause this difference.

Answer guidance

Suggest More than one answer may be acceptable, so long as it is consistent with the physics.

[2 marks]

This part can’t be checked automatically yet. Compare your own working with the explanation below.

Show explanationHide explanation

One correct answer. This part can’t be checked automatically yet, so compare your own working with it.

Name two variables that could differ between your set-up and the other student's and that change how much light reaches the LDR. The scheme accepts: the level of background light in the room; the type, mix or consistency of the cloudy liquid; the distance between the light source and the LDR; and how much water the cloudy liquid is mixed with.

Write each one as a quantity that can vary, for example "the distance between the light source and the LDR", and make sure your two answers are different variables.

5054/03/SP/23Cambridge O Level Physics 5054 · Specimen 2023 · Paper 3 · Question 1