Fig. 1.1 shows the speed-time graph for a vehicle accelerating from rest.
(a)Calculate the acceleration of the vehicle at time t = 30 s.
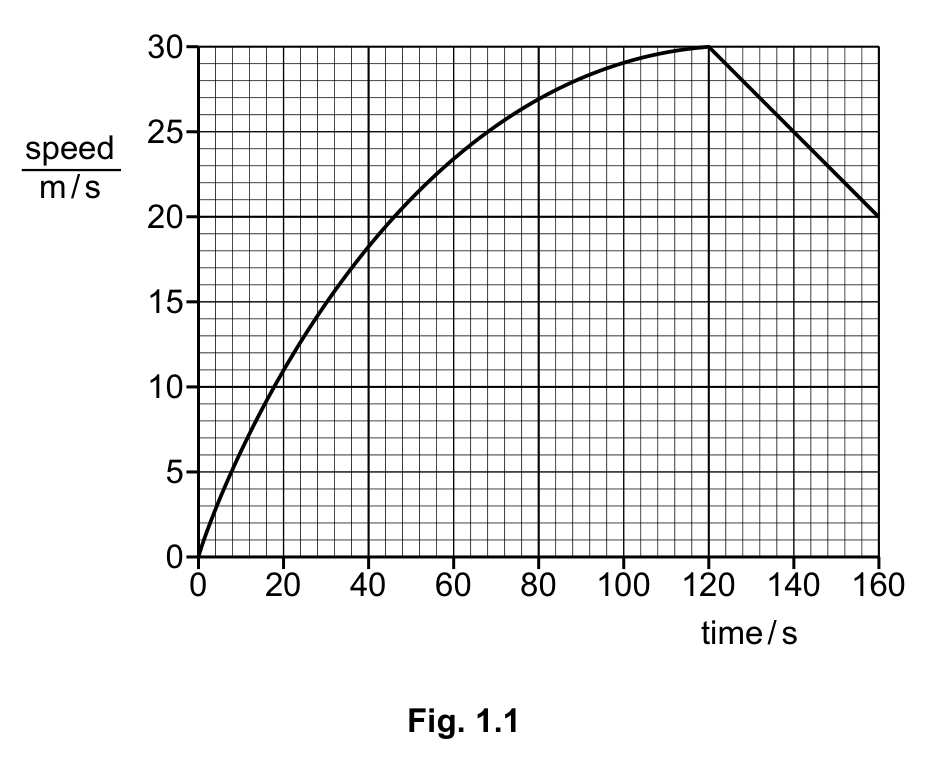
Fig. 1.1 shows the speed-time graph for a vehicle accelerating from rest.
(a)Calculate the acceleration of the vehicle at time t = 30 s.
Without further calculation, state how the acceleration at time t = 100 s compares to the acceleration at time t = 10 s.
(b)Using ideas about forces, explain why any change in the acceleration has occurred.
(c)Determine the distance travelled by the vehicle between time t = 120 s and time t = 160 s.
0625/04/SP/23Cambridge IGCSE Physics 0625 · Specimen 2023 · Paper 4 · Question 1